type in your search and press enter


EU Four charts to explain how the EU’s population is shifting
EURONEWS - 11 Jul, 2017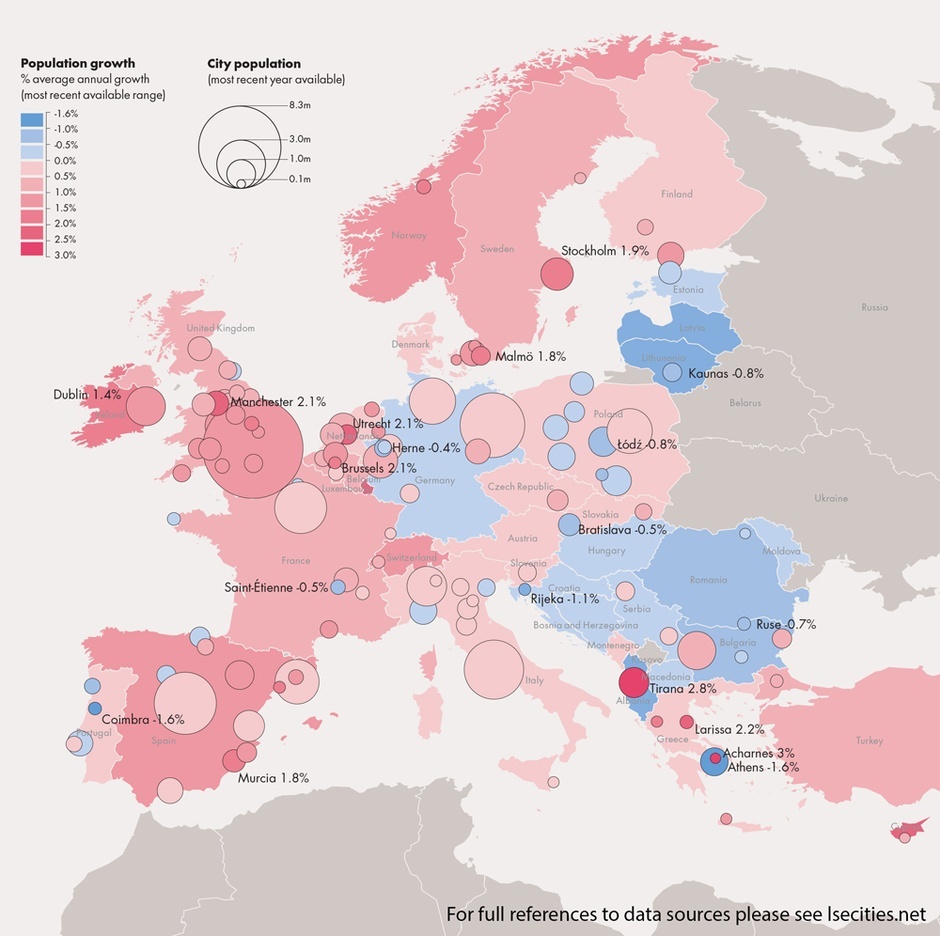
You May Also Like

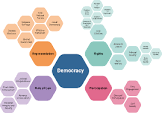
A roadmap for liberal democratic revitalisation
https://www.aspistrategist.org.au/a-roadmap-for-liberal-democratic-revitalisation/
PL Letter from Prime Minister Mateusz Morawiecki to the Heads of Governments and the Presidents of the European Council, the European Commission and the European Parliament on relations between national law and European law
https://www.gov.pl/web/primeminister/letter-from-prime-minister-mateusz-morawiecki-to-the-heads-of-governments-and-the-presidents-of-the-european-council-the-european-commission-and-the-european-parliament-on-relations-between-national-law-and-european-law