type in your search and press enter


Hands-on Guidance of Data Visualization in R Package “ggplot2” of NBA Players’ Stats
TDS - 13 Mar, 2020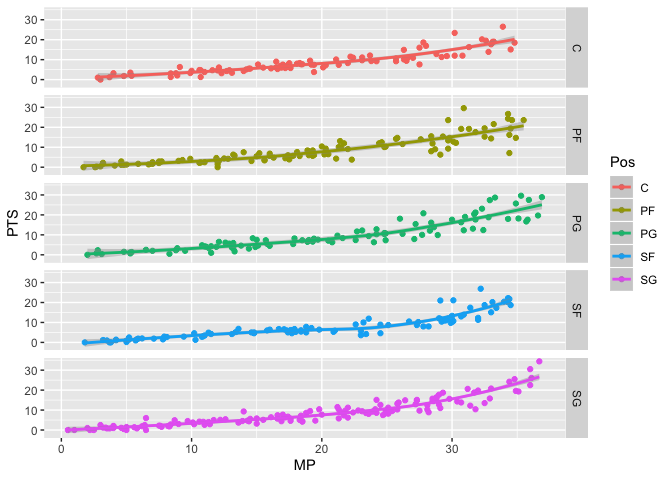
You May Also Like

- Development of Democracy
- EU Political Development
- Legal, Regulatory and Compliance
- Science and Technology
Health policy after the crisis: more of the same or a new path?
https://www.socialeurope.eu/health-policy-after-the-crisis-more-of-the-same-or-a-new-path

On the Afghanistan-Iran border, climate change fuels a fight over water
https://www.science.org/content/article/afghanistan-iran-border-climate-change-fuels-fight-over-water