type in your search and press enter


Hands-on Guidance of Data Visualization in R Package “ggplot2” of NBA Players’ Stats
TDS - 13 Mar, 2020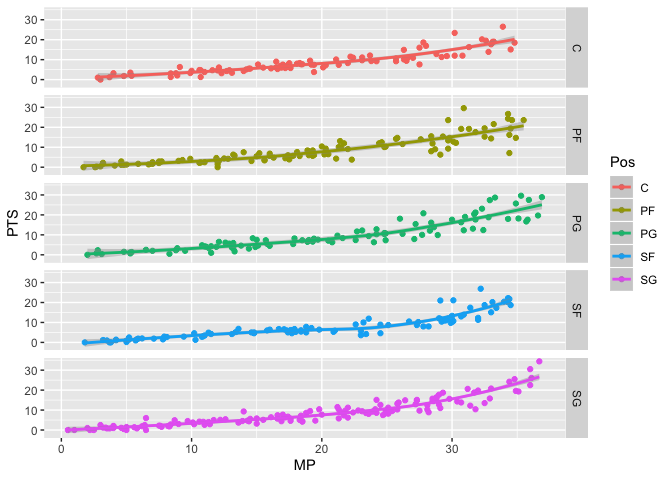
You May Also Like

Will we still have antibiotics in 50 years? We asked 7 global experts
https://theconversation.com/will-we-still-have-antibiotics-in-50-years-we-asked-7-global-experts-214950

¿Por qué los algoritmos se llaman algoritmos?
https://theconversation.com/por-que-los-algoritmos-se-llaman-algoritmos-229639